A single risk scoring methodology was silently excluding ~75% of potential customers.

The redesign made the module work for all of them, without adding complexity for anyone.

Case study cover 1
Case study cover 2
01 • Context

A module built for one way of thinking

The Risk Register is the operational core of a GRC platform, the place where compliance teams document, score, and track organizational risk. It's the module risk officers live in daily.

The customer base spans the full spectrum of financial services: small fintechs with lean risk programs, regional credit unions with established frameworks, and large banks with deeply customized methodologies built over years. Each segment has a different way of thinking about risk, and each has a non-negotiable opinion about how it should be scored.

The old system

A single fixed methodology

Impact × Likelihood = Inherent Risk, then layered with control effectiveness to produce a Residual score. Clean, logical, and familiar, but only if your organization already thought in those terms.

The limitation

No flexibility in how scores were composed

No separation between assessment types. No support for amplifier factors, custom dimensions, or weighted aggregation. The model was baked in, take it or leave it.

Who was affected

Any prospect whose risk methodology didn't map

In practice, that was the majority. They'd either adapt their workflow to the tool, or walk away.

Business cost

A product architecture problem

The module was structurally excluding a large share of qualified customers. It wasn't a sales or pricing problem, it was a product architecture problem.

02 • Problem

Three mental models, one rigid system

Through discovery conversations and sales team feedback, a clear picture emerged. The customer base didn't have one way of scoring risk, it had three distinct approaches, each with its own logic and its own expectations for how configuration should work.

Only the standard model was supported. The amplifier model, where composite factors feed into a final score, required configuration the system didn't offer. The custom model, often used by larger institutions with single-risk-type focus or non-standard logic, broke the matrix concept entirely. Both segments were being turned away or asked to compromise.

03 • My Role

Sole & Lead designer, expert collaboration

I was the sole designer on this project, responsible for the full arc from discovery through final delivery. The work involved not just interaction design but workflow logic, stakeholder alignment across a cross-functional team, and direct client presentation.

Design Ownership End-to-end UX: discovery, information architecture, interaction design, prototyping, and final design documentation handed off to engineering.

Cross-Functional Collaboration Balanced domain expertise with usability constraints through close partnership with strategy, leadership, and implementation.

Collaborators: Director of Compliance & Strategy VP Head of Implementation

Client Presentation Presented designs directly to prospect groups across segments, small fintechs, regional banks, large institutions, and credit unions, gathering real-world validation.

04 • Design Challenges

One system, three ways of thinking

📌 Standard

Standard users already had a mental model that worked. The redesign couldn't slow them down or introduce friction into a workflow they'd already mastered. For this segment, the configurable system needed to feel invisible, the default just needed to work without setup overhead.

📈 Amplifier

Amplifier users needed control over how multiple input factors were combined and weighted into a final score. The design challenge was giving them meaningful configurability, real influence over the math, without presenting a formula editor that compliance managers shouldn't need to operate.

🧩 Custom

Custom model users often focused on a single risk dimension, breaking the 2D matrix concept entirely. Their scoring logic didn't map to rows and columns. Designing for this segment meant rethinking how risk output was visualized without making the other model types feel like they'd been compromised to accommodate it.

05 • Key Decisions

Four decisions that defined the system

Configurable Risk Scoring Models

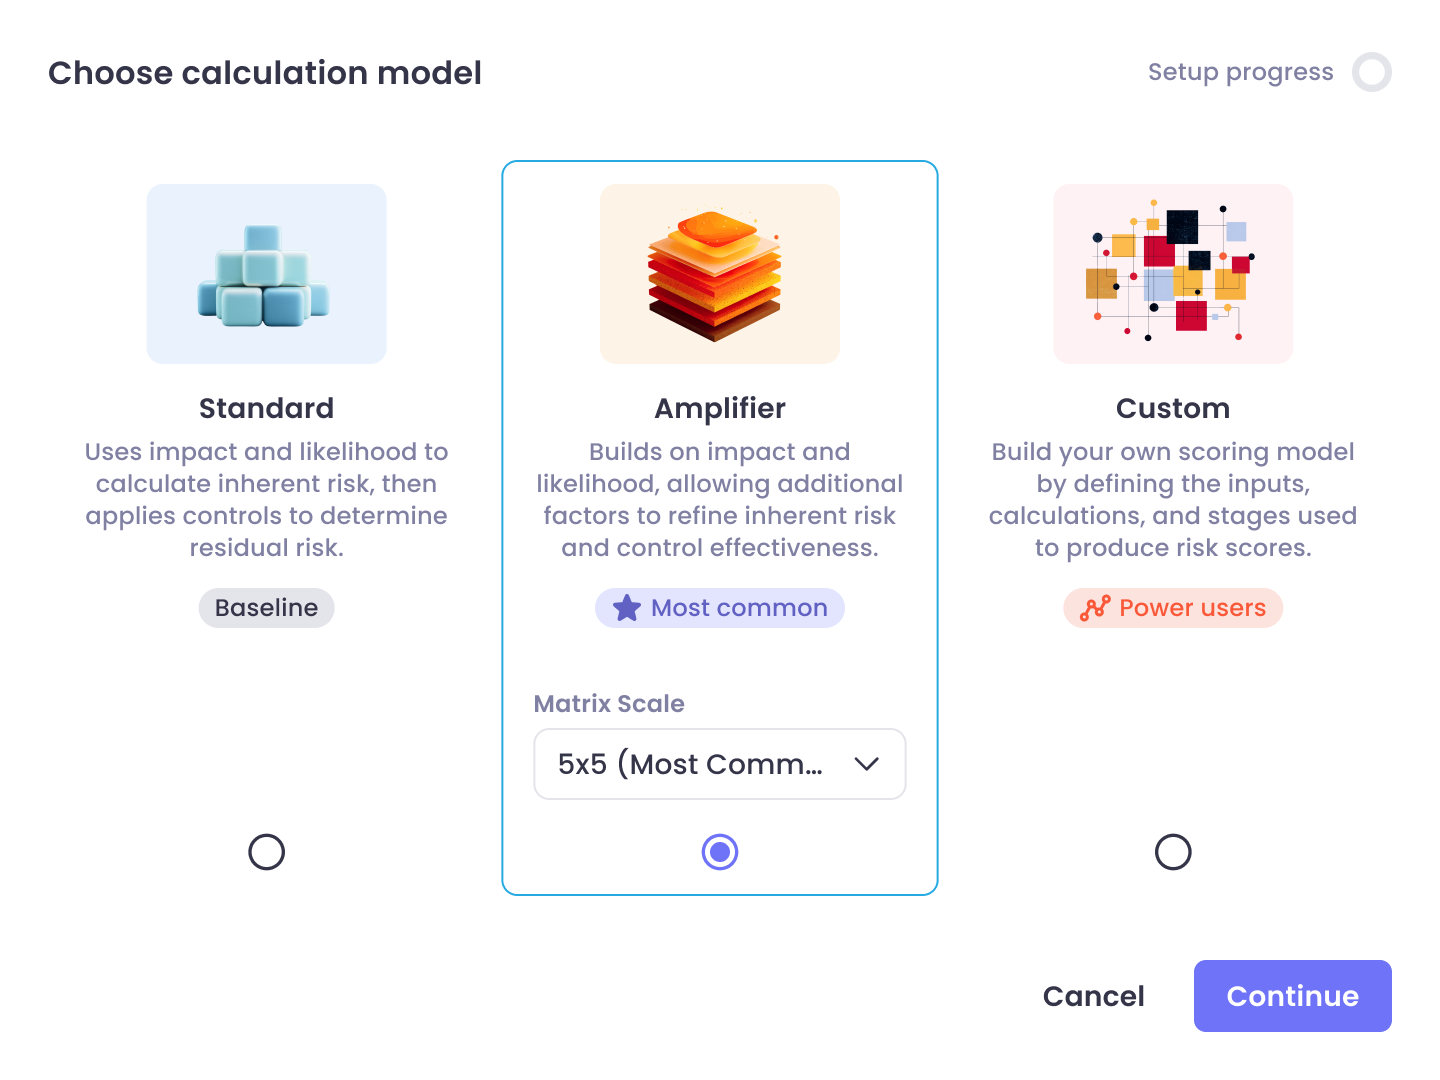
The model selection needed to happen early in setup, but without overwhelming users who'd never thought about model types before. The solution was a guided selection step that presented three clearly labeled options with plain-language descriptions and formula previews. Each option only revealed its configuration needs once selected, keeping the initial screen clean. Users who just needed "standard" could be in and out in seconds. Users building something more complex had a clear path forward.

Model Who it's for Setup experience
Standard Teams using impact × likelihood + controls Defaults first; minimal configuration
Amplifier Teams stacking weighted sub-factors into a roll-up Guided hierarchy after model pick
Custom Single-dimension focus or non-matrix logic Dedicated path once selected
Level Rolls up from What reviewers see
Overall residual Domain scores Top-line score + drill-in
Domain Factors Weight in parent + own score
Factor Sub-factors Contributing inputs + weights
Sub-factor Raw assessments Leaf values for audit

Multi-Layer Risk Aggregation

The amplifier model required scores to roll up through multiple levels, sub-factors aggregating into factors, factors into domain scores, domains into an overall residual. The challenge was making this hierarchy traceable without being overwhelming. The design used a collapsible tree structure where each node showed its own score, its weight in the parent calculation, and a clear path back to the contributing inputs. Users could drill in when they needed to audit a result, and collapse back to the summary view when they didn't.

Custom Weighting & Calculations

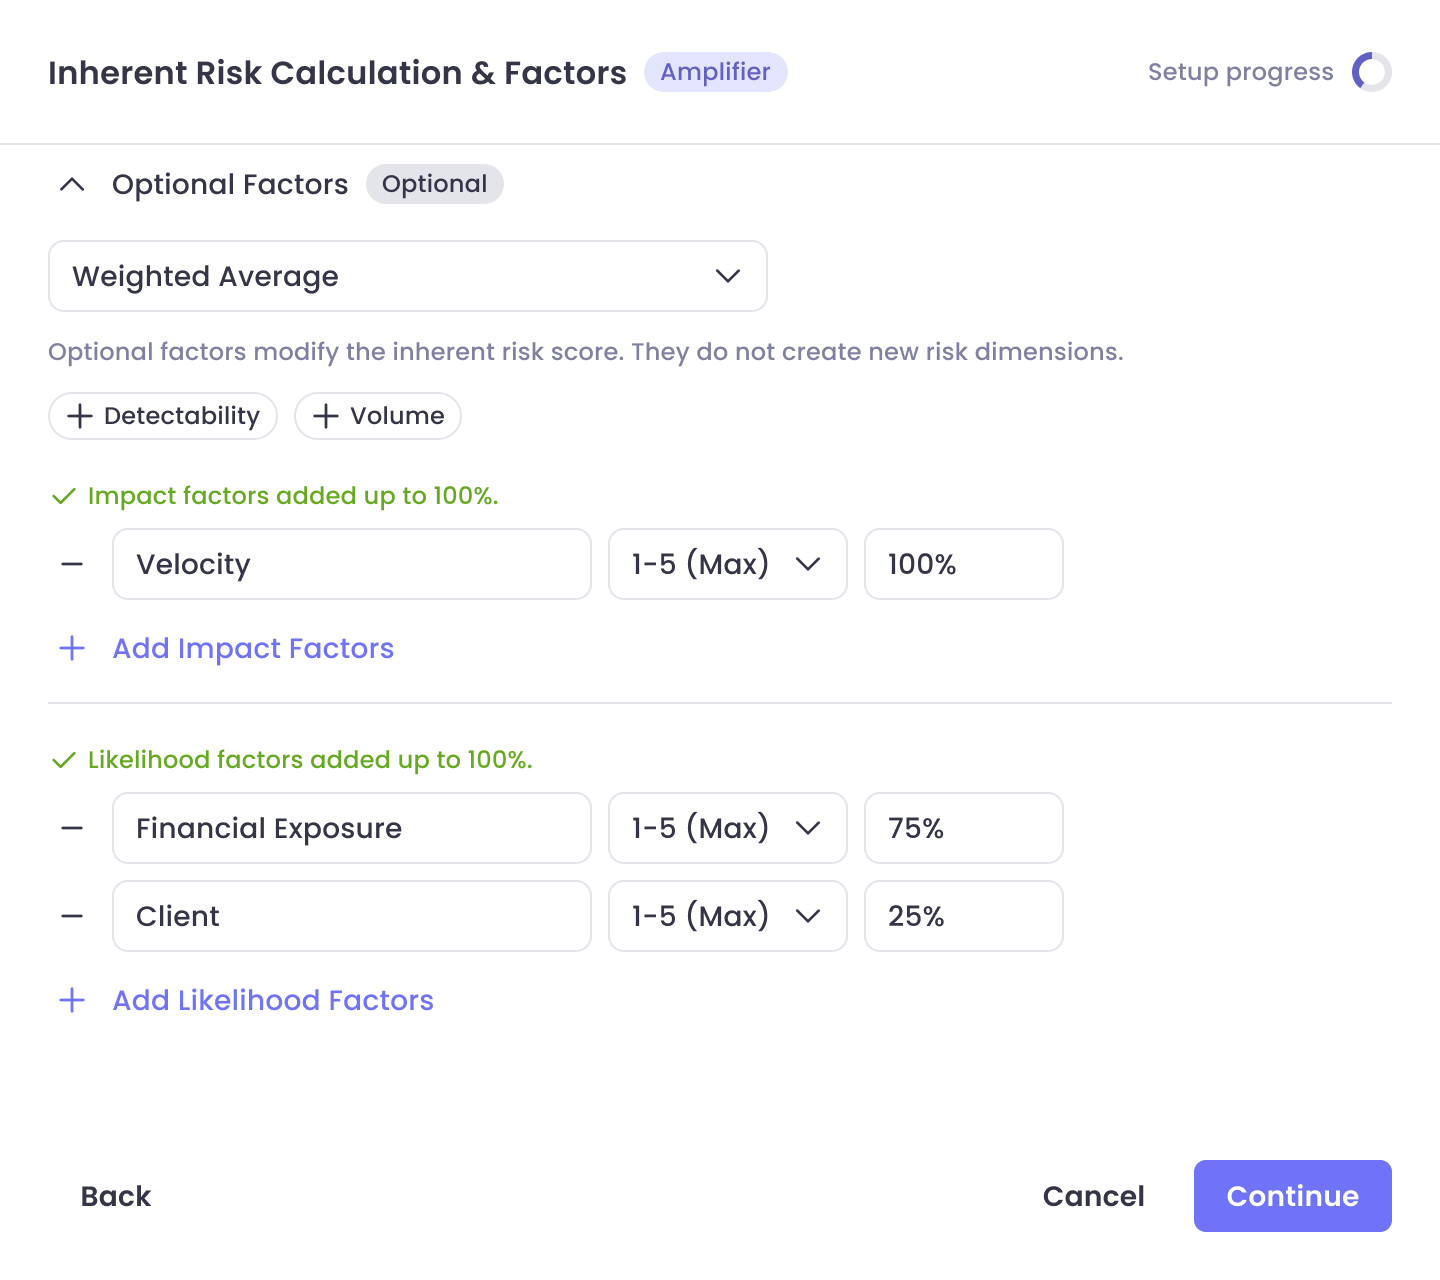
Risk experts care deeply about how their numbers are composed, and have strong opinions about weighting. The design gave them direct control over factor weights through a constrained input system: sliders with percentage values that auto-balanced to 100%, with a live total indicator. The underlying math stayed invisible; users shaped it through intent, not formulas. Edge cases, like a user trying to submit with weights that didn't sum correctly, were handled with inline validation rather than error states after submission.

Custom weighting UI: sliders with a live total and inline validation
Output type Visualization Rationale
Standard & amplifier Dynamic 5×5 matrix from configured ranges Familiar grid; reflects true 2D scores
Custom (single dimension) Linear scale, same risk color banding No false 2D read when data isn't matrix-shaped

Adaptive Risk Matrix Visualization

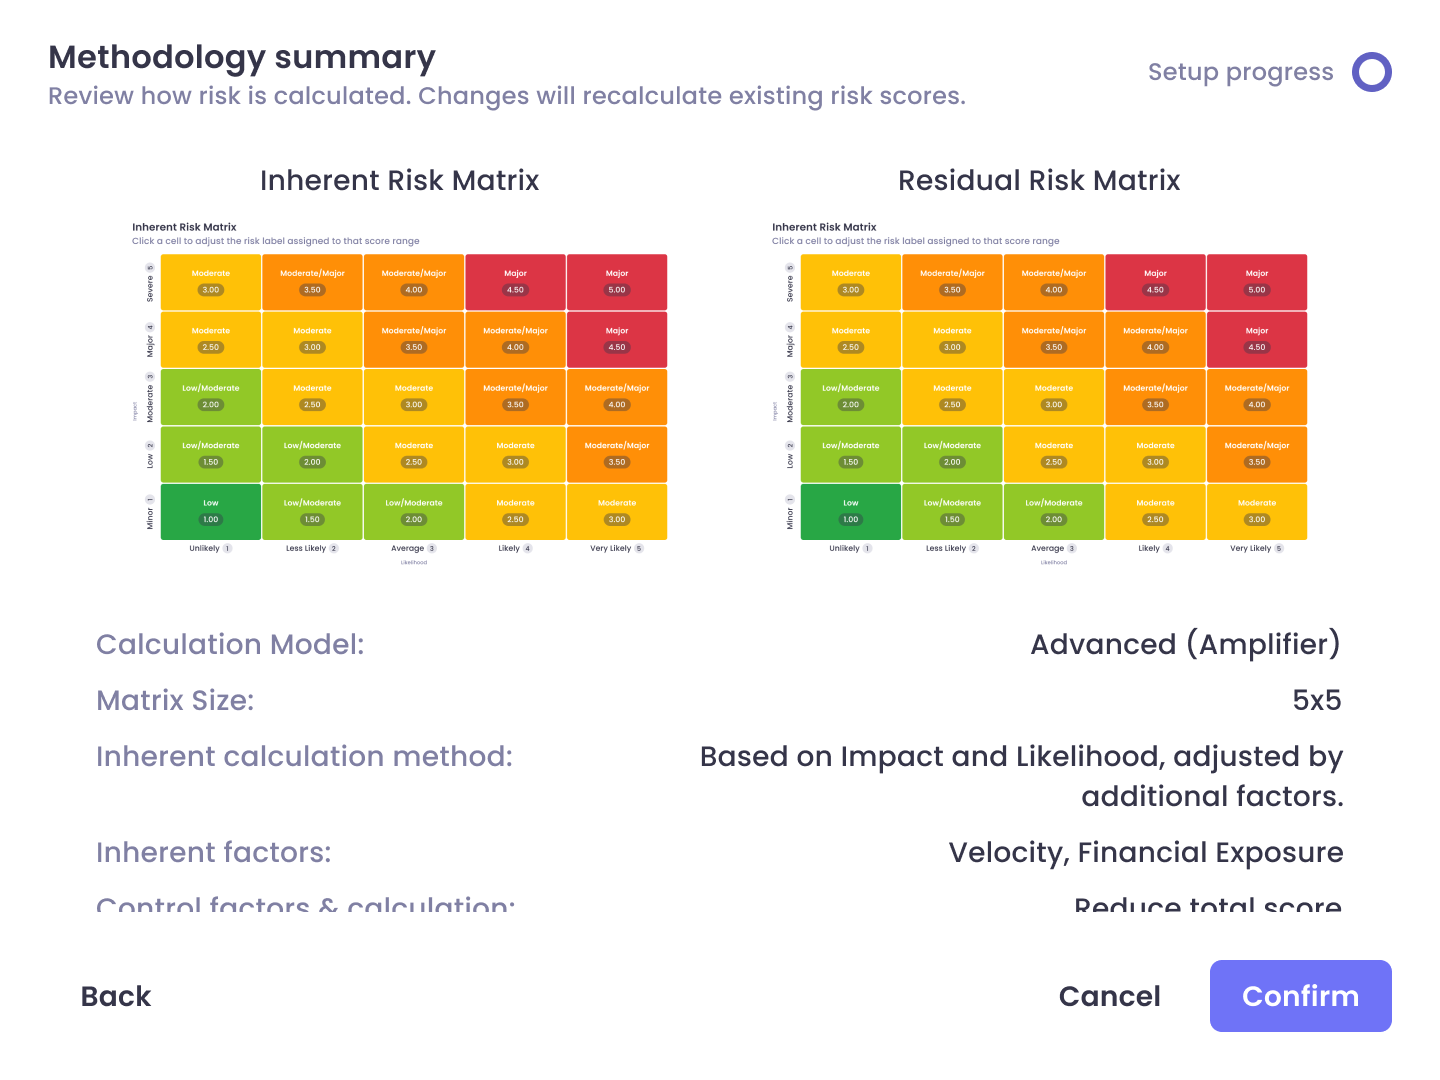
The 5×5 risk matrix is one of the most recognizable artifacts in compliance work, and one of the most opinionated. The challenge was making the visualization adapt to reflect each model's output accurately, rather than forcing every output into a 2D grid that might not fit. For standard and amplifier models, the matrix rendered dynamically based on configured scoring ranges. For custom models with single-dimension outputs, the visualization shifted to a linear scale, preserving the familiar risk-color coding without misrepresenting the data as two-dimensional when it wasn't.

06 • Outcome

A module that finally fit the market

The designs were presented directly to prospect groups across the full customer spectrum, small fintechs, regional banks, large institutions, and credit unions. The reception was consistent: the flexibility mapped cleanly to how each segment already thought about risk, without asking them to adapt their methodology to the tool.

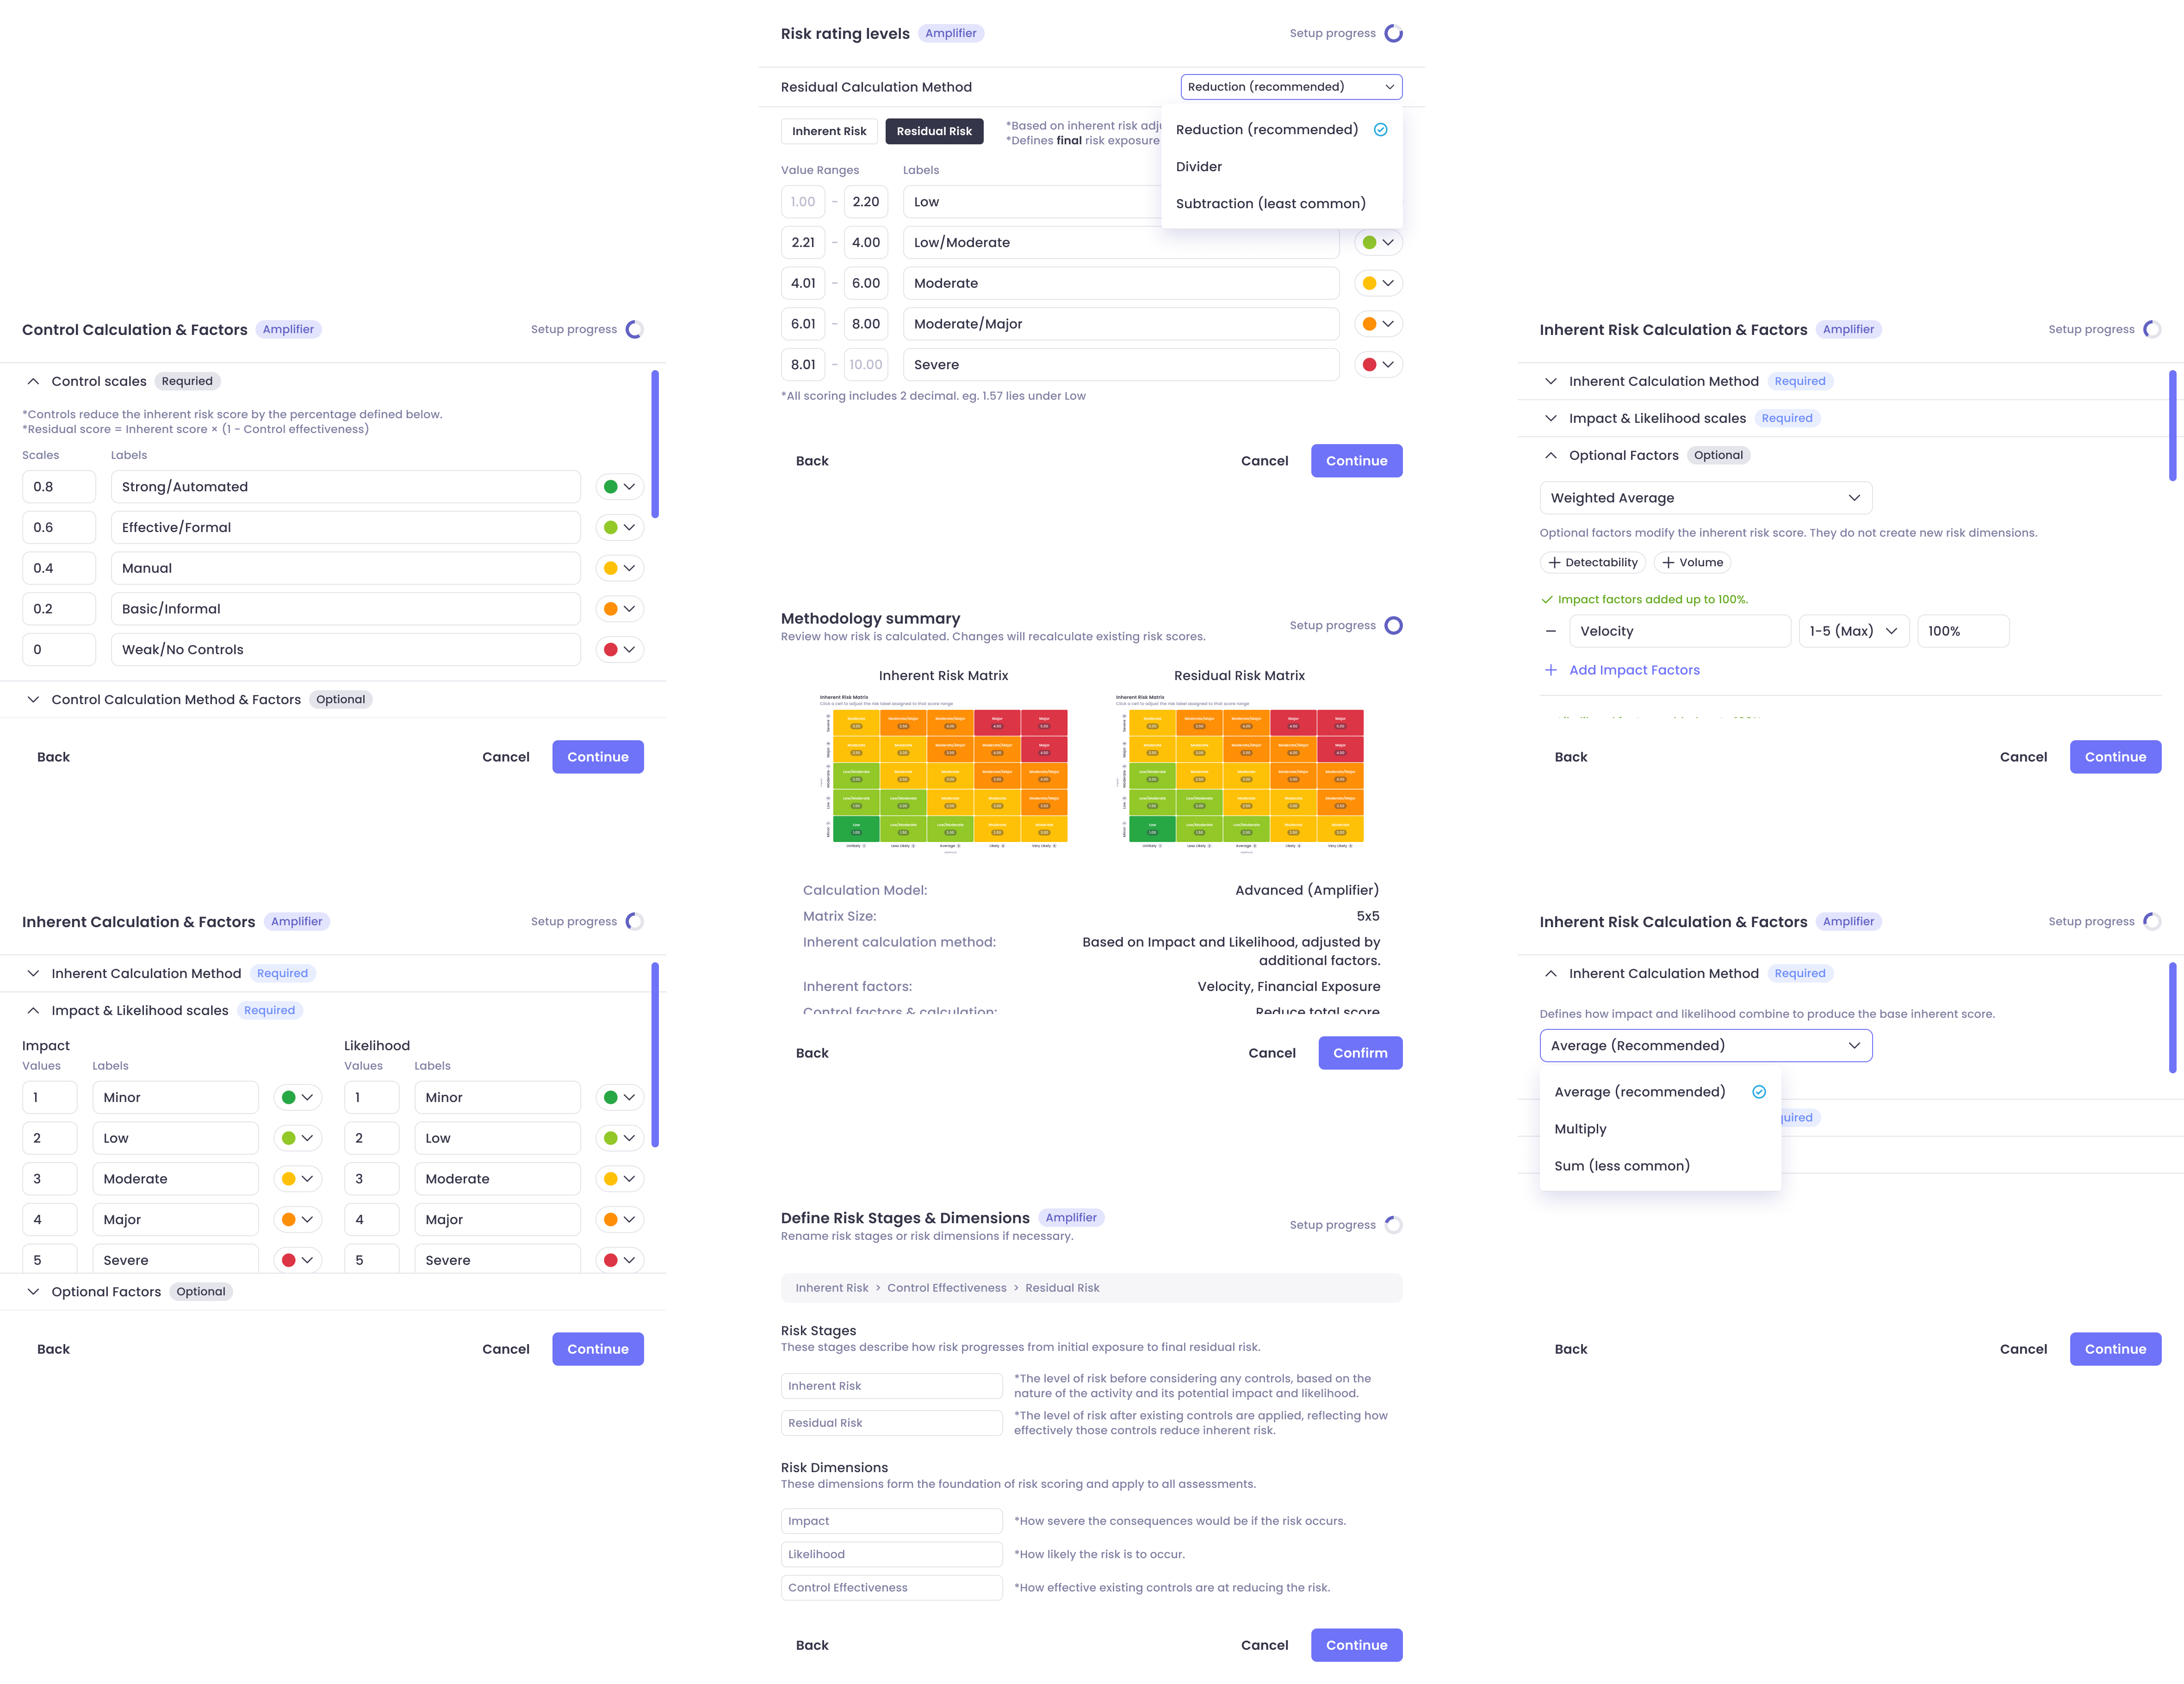
Delivered risk scoring module: configuration and flows shown as presented to prospect groups across segments.

Addressable customer segments supported by a single module configuration system

~75%

Of previously excluded customers now accommodated by the redesigned system

4

Prospect groups validated across segments, positive reception across all of them

The most significant outcome wasn't a metric, it was that the module stopped being a blocker. Prospects who'd previously been told the platform "didn't quite fit" their risk methodology now had a path forward. The design work turned a structural product limitation into a genuine competitive differentiator.

07 • Reflection

What I learned about designing for configurability

Hardest part Designing simultaneously for risk novices and deeply opinionated experts. A compliance officer at a large bank has spent years refining a methodology, they don't want to be guided through a wizard. A lean fintech team wants exactly that. The solution was progressive disclosure done seriously: the system always started simple, but never treated advanced users like they needed hand-holding to get to the configuration they came for.

What I'd revisit The custom model experience still felt like a slightly diminished version of the amplifier flow rather than a fully first-class path. Given more runway, I'd have pushed for a dedicated configuration paradigm for single-dimension scoring, one that didn't carry any visual residue of the 2D matrix model. The matrix metaphor is strong and familiar, but it can also be a cage when the underlying data doesn't fit it.

What this taught me Configurability and simplicity aren't opposites, they're sequencing problems. The system doesn't need to hide complexity; it needs to introduce it at the right moment, to the right user, with the right framing. The instinct to simplify by reducing options is often wrong. The right move is to simplify by clarifying which options belong to which context, and trusting that users can handle more when it's presented on their terms.